RubiSight
Data Visualization
RubiSight is a DATA STORYTELLER
RubiSight provides a drag-and-drop interface for creating visually appealing interactive dashboards. It offers visual data analytics and exploration for a better understanding of data and hidden insights.- Drag & Drop Interface
- Data Preparation
- Visual Analysis
- Dynamic Dashboards
- What-if-Analysis
- SaaS & PasS
- Pre-built Widgets
- Embedded Analytics
- Security & Governance
- Geo visualisation Data Alerts
- Pre-built Widgets
- Automation & Scheduling
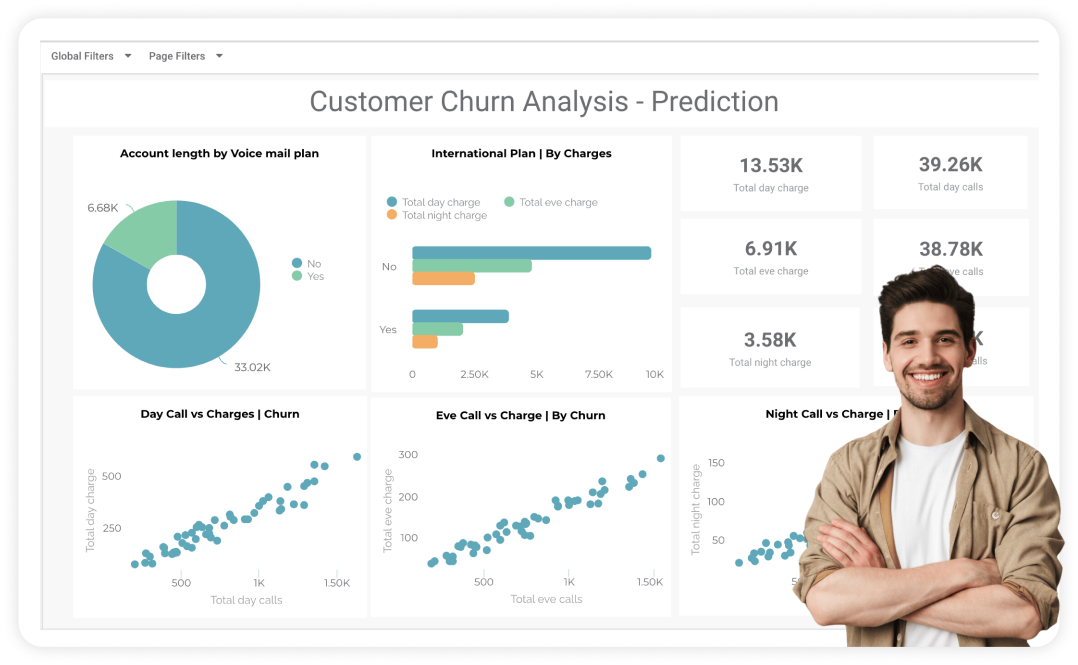
Glimpse How Users Interact with RubiSight
Insights at Your Fingertips
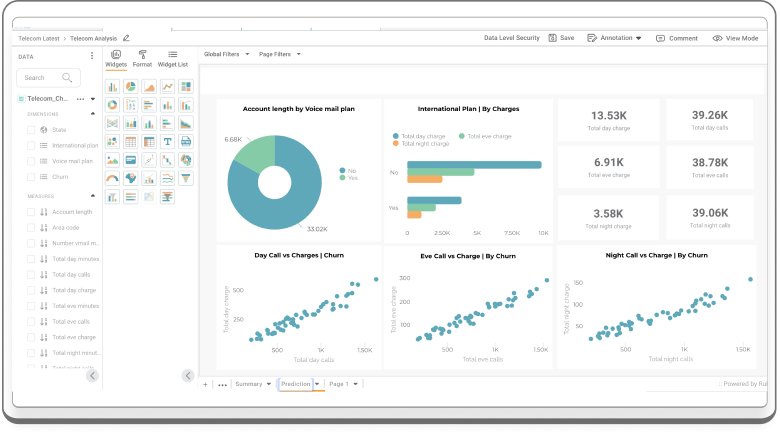
Build interactive dashboards in minutes, no coding required.
- Build dashboards in minutes, no code needed.
- Drag & drop, customize, and arrange data visualizations.
- Empower anyone to create professional-looking dashboards.
- Unlock data insights, even for non-technical users.
- Make data-driven decisions faster
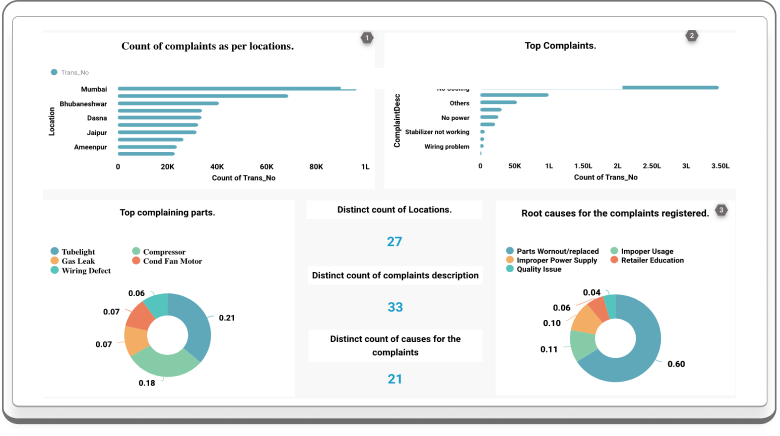
Uncover Hidden Patterns
Filter & Slice data to reveal deeper trends and correlations
- RubiSight: Dig deeper with interactive dashboards.
- Filter & drill down to uncover hidden insights.
- Go beyond static reports, find hidden patterns.
- Interactive exploration leads to richer data understanding.
- Make smarter decisions with data-driven insights.
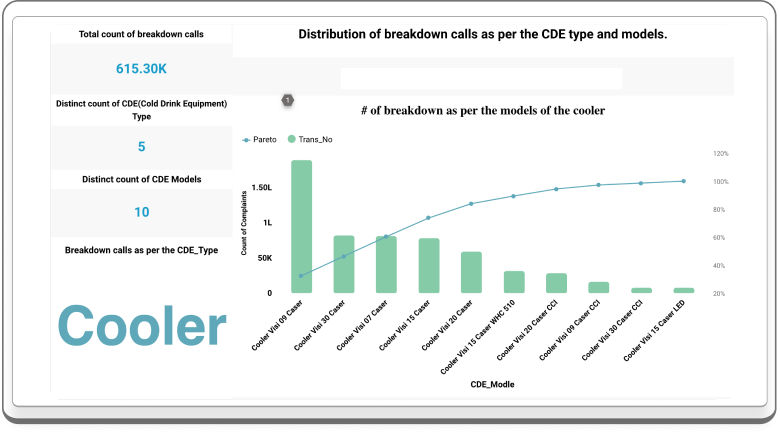
Let Data Speak For You
Visualize diverse data with a set of customizable widgets,
- RubiSight supports various data types:
numerical & categorical. - Extensive widget library offers,perfect visualization for data.
- RubiSight: Turn data into stories.
- Choose from charts , network diagrams ,etc
- Effectively communicate insights with clear visualizations.
Why RubiSight?
Tell Brighter Stories and see the Bigger Picture with data.
Rubisight makes your data like pictures, easy to see and understand.
It helps you make good business choices, no computer skills needed.

It helps you make good business choices, no computer skills needed.
Begin your Journey Today
As a Data Visualiser

Customers Speak
Explore real success stories with Rubisight. Hear directly from clients who have benefited from our data science solutions. See how Rubisight drives efficiency and enhances decision-making across industries.
[wp-testimonials widget-id=4]
LEARN
Become Data Visualizer
Unlock the power of Visual Storytelling with Rubiscape’s Data Visualization course
